Summary
The concentration of DNA in the solution (31 μg/mL and 144 μg/mL) was measured in a fiber spectrophotometer (TIDAS-1) using a spectral pipette (WPI-SPT-2) under ultraviolet and visible light sources. Since there is only a 1 cm path length, the use of a spectral pipette does not require pre-measurement dilution within this concentration range, thus eliminating potential errors. Due to the compact design of the spectral pipette, 10 μL of the sample can be routinely tested in a standard 200 μL PCR vial. Even if the tip position of the electrode is sufficiently careful in the PCR vial, samples as small as 5 μL can be repeatedly measured.
experiment procedure
A standard solution of DNA (Sigma D1626) was prepared by gravity method using 18.2 MΩ/cm ultrapure water as a solvent, and the concentration of the standard solution was between 0.0 μg/mL and 143.9 μg/mL. A triplicate solution was measured using a spectral pipette and the spectral pipette was attached to a fiber spectrophotometer equipped with an ultraviolet and visible light source. The data was collected every 1 nm increase in the full range of the instrument (190 nm - 720 nm) and the instrument must measure a solution that produced a total of 80% absorbance. All measurements used 18.2 MΩ/cm ultrapure water as the reference solution.
result
The experimental results are as follows
Table 1: DNA concentration and absorbance values
DNA [μg/mL] | 260 nm absorbance [AU] |
0.00 | -0.0061 ± 0.0001 |
30.83 | 0.5745 ± 0.0011 |
56.59 | 1.0309 ± 0.0020 |
85.49 | 1.4497 ± 0.0016 |
115.66 | 1.7170± 0.0025 |
143.94 | 1.8280 ± 0.0006 |
                      Â
Because the relationship between absorbance and concentration follows the Beer-Lambert law, namely:
A= εlc
The expected absorbance can be calculated from the concentration in the DNA solution, and the DNA solution transmittance coefficient ε is listed as 0.020 μg/ml*cm.
The expected absorbance can be calculated from the concentration in the DNA solution, and the DNA solution transmittance coefficient ε is listed as 0.020 μg/ml*cm.
The absorbance measurements obtained by calculation can be seen in Figure 1 as a line indicating the absorbance measurement at a wavelength of 260 nm . At higher absorbance values, the deviation from the theoretical value is due to the interference of scattered light in the fiber spectrophotometer.
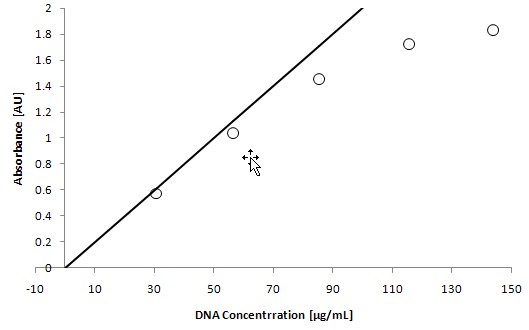
Figure 1: Measured and theoretical values ​​of absorbance
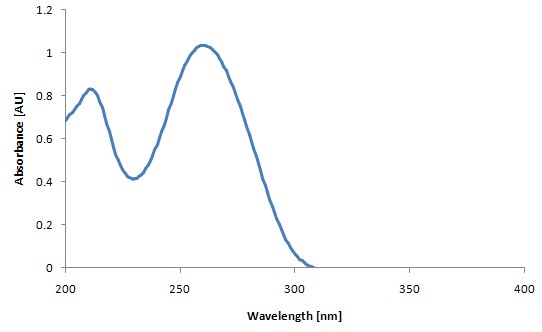
Figure 2: Typical DNA measurement chart (56.6μg/mL)
Spice Novelties Co.,Limited , https://www.wholesale-adult-toys.cn