Dirk Krumwiede, Hans-Joachim Huebschmann,
Thermo Fisher Scientific, Bremen, Germany
Key words
TSQ Quantum XLS, dl-PCBs, Food Safety, Isotope Dilution, PCBs, SRM, WHOPCBs
Introduction
Polychlorinated biphenyls (PCBs) are a class of highly durable industrial chemicals used primarily in transformers, capacitors, inks, coatings, pesticides, dust control, and the manufacture of insulating liquids. It is estimated that the total global PCBs production has reached 1.5 million tons. Between 1930 and 1977, the United States was the single largest producer of PCBs, producing more than 600,000 tons of PCBs. The European region followed closely, with an output of 450,000 tons in 1984.
Polychlorinated biphenyls include 209 different monomers (homologues) that have different effects on health. Although the United States banned the production of PCBs as early as 1977, products made with PCBs are still in use. Because PCBs degrade slowly in the environment, they can be carried by airflow to all corners of the earth. PCBs have contaminated the bodies of all animals and humans on Earth.
The Stockholm Convention on Persistent Organic Pollutants lists PCBs as one of the twelve most dangerous compounds known to the world to be harmful to humans and the environment. Although the level of dioxin in the body is slowly and steadily decreasing, reflecting that various efforts to prevent proliferation have generally achieved certain results, however, the level of PCBs pollution is not expected to change globally (2007 Tokyo Dioxin Symposium) ). Monitoring of dioxin levels as a work item for the Stockholm Convention will continue for many years and will involve the collection of large numbers of samples, especially for dangerous dioxin-like PCBs (dl-PCB). It is worth mentioning that coplanar dl-PCB, that is, non-meta-substituted PCB, has become a focus of food safety control due to its similar toxicity to 2,3,7,8-TCDD. dl-PCBs also contribute significantly to sample toxicity equivalent (TEQ) values.
This application note details a fast, reliable, and highly selective trace screening method for quantitative analysis of PCBs in environmental, food, and biological samples using the Thermo Scientific TSQ Quantum XLS Triple Quadrupole Mass Spectrometer. . The analytical strategy of this method is similar to the method 1668A established by the US Environmental Protection Agency (USEPA).
Due to differences in analytical responses, each chlorinated compound was quantified based on the internal standard compound labeled with the respective isotopes. This guarantees the best analytical accuracy and similarity of similar compounds. The internal standard compound was labeled with 13C for the biphenyl skeleton, for a total of twelve label sites. A 13C-labeled PCB is added to the sample to ensure accurate identification during the analysis and to correct for the original (unlabeled) compound concentration.
This method is commonly referred to as "isotopic dilution quantification." In this document, an "L" is added after the IUPAC class number to indicate the labeled compound; for example, 101L represents the pentachlorobiphenyl congener 101 with an isotopically labeled form.
Experimental condition
Instrument settings
Sample analysis was performed using a TSQ Quantum XLSTM GC-MS/MS system equipped with a Thermo Scientific TRACE GC Ultra gas chromatograph. The TRACE GC UltraTM is equipped with a split/splitless inlet with a Thermo Scientific TriPlus AS liquid autosampler. The capillary column was a 30-meter Thermo Scientific TRACE TRDioxin 5MS column (5% phenyl film) with an inner diameter of 0.25 mm and a film thickness of 0.10 μm. Table 1 records the parameters of the gas chromatograph, autosampler, and mass spectrometer.
Table 1. TSQ Quantum XLS, TRACE GC Ultra, and TriPlus Autosampler Instrument Setup

Sample measurement
USEPA Method 1668 describes a method for determining PCB congeners. ...[Method 1668] was developed by the US Environmental Protection Agency's (EPA) Office of Science and Technology to specifically target the highly toxic polychlorinated biphenyl (PCB) congeners specified by the World Health Organization (WHO). A specific method for the detection of more than 150 chlorobiphenyl (CB) congeners has been included in Amendment A to Method 1668. The levels of initiation and termination of toxic PCBs and chlorinated PCBs were determined by isotope dilution high resolution gas chromatography/high resolution mass spectrometry (HRGC/HRMS). Other CBs use the internal standard method HRGC/HRMS. Method 1668A is suitable for aqueous, solid, tissue, and multiphase sample matrices.
This application uses a commercial EPA 1668 standard (Wellington, Guelph, Ontario, Canada). 68A-CVS is a common calibration solution for USEPA Method 1668 Revision A, HRGC/HRMS method. All internal standards (ISTD) for each PCB chlorination are similar to 12 13C markers. Sample and internal standard processing and analytical strategies are performed in full compliance with EPA Method 1668A.
TSQ Quantum XLS SRM Settings
Although USEPA Method 1668 requires that the analyte be "... separated by gas chromatography and detected by a high resolution (R 10,000) mass spectrometer, [and contain] two accurate mass-to-charge ratio values... and in a retention time window determined in advance Monitoring each chlorination level from start to finish. The method developed in this application article actually uses a triple quadrupole mass spectrometer as an alternative to HRMS. The TSQ Quantum XLS quadrupole is a hyperbolic quadrupole. Can effectively improve selectivity. According to the ranking of analytical methods in the European Commission Directive 96/23/EC, the GC-MS/MS method has similar or higher identification points than HRMS, especially when using MS/MS-based independent ion pairs (Table 2). .
Table 2. Example of the number of identification points obtained by the GC/MS analysis method (n = integer).
* identifies the method described in this article.

According to the European Commission Directive 96/23/EC, the method for confirming the application of organic residues or contaminants must be based on full-scan technology or “if the method does not record a full-sweep spectrum, at least four identification points are required (PCBs, II) "Evil, furan, etc.", which is a common target compound multi-ion detection method (MID).
The measurement system of this method follows the European Commission Directive 96/23/EC by using a secondary mass spectrometer ion pair from two PCB primary ions and performing specific ion detection for each chloride degree. Five identification points are provided for each PCB monomer compound.
We monitor the loss of two chlorine-based secondary ions based on the molecular ion (12C12H10-x 35Clx) relative to the 37Cl isotope (12C12 H10-x 35Clx-1 37Cl) by collision-induced dissociation (CID) fragmentation. Ion pair (Table 3). The isotope internal standard was also detected by the same method, but with 12 13C marks, it has a mass displacement of 12 Daltons.
Table 3. SRM data acquisition system for PCBs, with MID detection of two daughter ions for each primary ion. The terminology of the PCB is taken from EPA Method 1668 and reflects the level of chlorination.
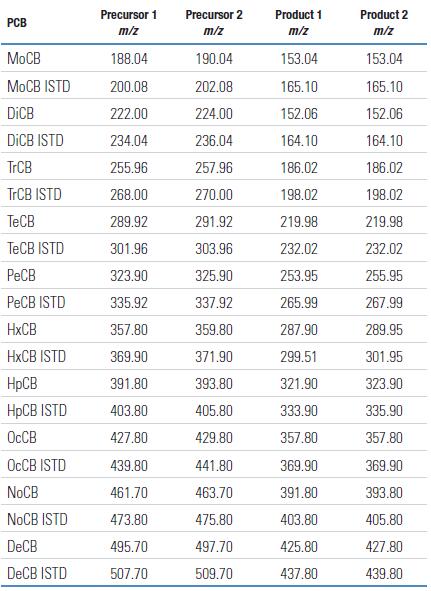
It should be noted that when selecting a primary ion, there is only a single isotopic HxCB molecular ion M+, such as m/z 357.80 C12H4
35Cl6 will generate specific secondary ions. The next ion in the isotope peak, m/z 359.80, carries a 37Cl, which statistically produces two secondary ions, of which only one has 37Cl. This isotope effect causes the secondary ion abundance to decrease as the degree of chlorination increases.
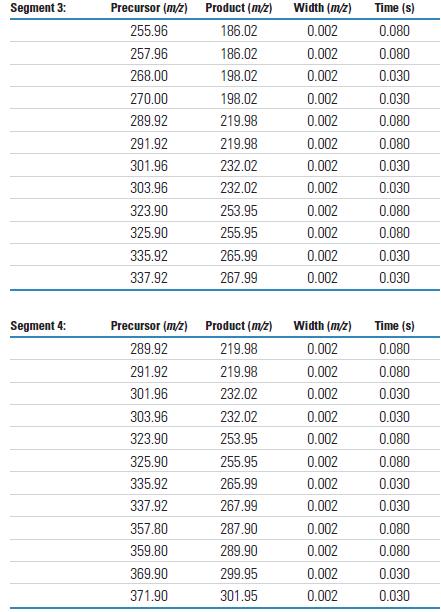
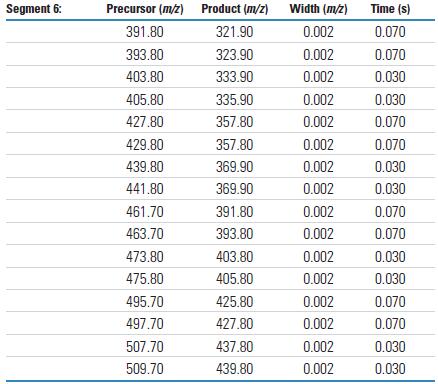
The analysis sequence in Selective Ion Monitoring (SRM) mode uses six (6) retention time windows and overlapping mass intervals to detect all ten degrees of chlorination (LOC). In addition to time period 1, there are always two levels of chlorination that are monitored in parallel. This setup is due to the fact that PCB congeners of adjacent chlorination are always alternately eluting. The number of masses analyzed during each SRM analysis period shows the speed and capacity that the TSQ Quantum XLS can achieve when performing multi-component parallel inspection tasks. Tables 4 and 5 detail the SRM time periods and settings.
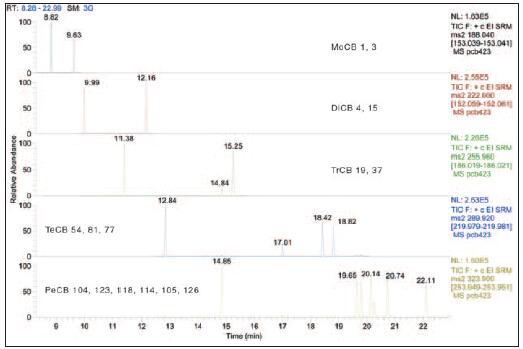
Figure 1. Extracted ion chromatogram of a PCB standard from monochlorinated to pentachloro PCB (1 pg on the column)

Figure 2. Extracted ion chromatogram of a PCB standard from hexachloro to decachloro PCB (1 pg on the column)
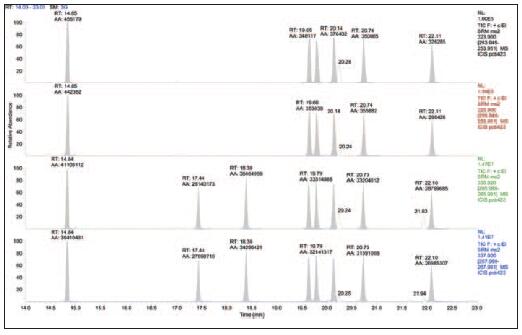
Figure 3. Pentachloro-PCB congeners in the standard, using two independent SRM ion pairs to detect the target compound (top) and isotopically labeled (bottom) PCB congeners 104, 123, 118, 114, 105 , 126. The ISTD spectrum also shows the 101L and 111L components.
Results and discussion
Method development
Each chlorinated compound of all PCB homologs is detected by two independent SRM ion pairs. Each ion pair uses a different chloride isotope peak of the molecular ion as the primary ion. Data collection is based on the SRM detail tables listed in Tables 4 and 5. The MS/MS results obtained by the TSQ Quantum XLS are shown in Figures 1 and 2. Figure 1 shows the spectrum from a chlorinated to pentachloro PCB, while Figure 2 shows the spectrum from hexachloro to decachlorobiphenyl. These results were obtained using the SRM ion pair parameters listed in Table 3. The mass spectra in Figures 1 and 2 use the most abundant primary ions for each compound to show the order of the chlorine. All congeners can achieve high response detection with each SRM ion pair. The observed decrease in signal abundance is due to a decrease in the isotopic peak concentration of PCB molecular ions as a function of statistical law when the injection volume is 1 pg on the column.
Figure 3 compares two independent SRM ion pairs for one degree of chlorination. The top mass spectrum represents primary ions from the unlabeled pentachloro PCB congeners with mass-to-charge ratios of 323.90 and 325.90, while the bottom mass spectrum is an isotope-labeled internal standard compound (mass-to-charge ratios of 335.92 and 337.92). Primary ion). This comparison demonstrates that the spectra between different SRM ion pairs are highly consistent, supporting the reliability of PCB identification.
These SRM spectra obtained by the TSQ Quantum XLS Triple Quadrupole mass spectrometer in standard resolution mode (0.7 Da peak width) show good correlation with data obtained by gas chromatography and high resolution mass spectrometry (GC-HRMS). degree. In the case of the pentachloro PCB shown in Figure 3, the TSQ Quantum XLS method achieves the high certainty required by the EU Directive by using independent ion pairs based on two different primary ions. Even when two chlorinations are monitored in parallel in each SRM window, the TSQ Quantum XLS Analyzer's high operating speed provides at least 6 to 8 data points per peak. This makes the integration and quantitation of the chromatographic peaks very reliable.

Figure 4. dl- pentachloro PCB in blood samples
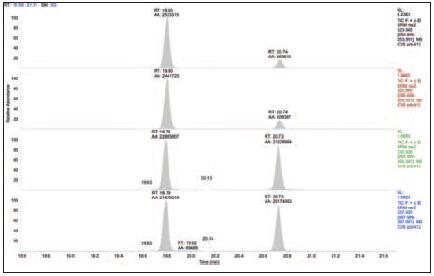
Figure 5. dl- pentachloro PCB in milk samples

Figure 6. dl- pentachloro PCB in egg yolk samples
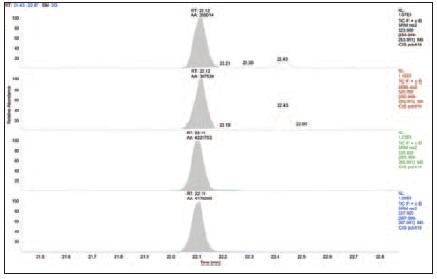
Figure 7. dl- pentachloro PCB in green cabbage samples
Performance in complex sample matrices
To validate this chromatographic and mass spectrometric method in complex matrix samples, we have prepared several very challenging sample matrices. The TSQ Quantum XLS showed excellent sensitivity, selectivity and durability in the analysis of these samples, as shown in Figures 4 to 7. These results allow us to compare the results of the analysis of pentachloro PCBs obtained from samples containing matrices such as blood, milk, egg yolk, and green cabbage. The TSQ Quantum XLS provides a clean, background-free ion chromatogram in all of these matrices. The selectivity of the process is more apparent when comparing these matrix samples to the standards shown in Figures 1-3. Even in the case of complex sample matrices, such as blood samples (Figure 4) and green cabbage samples (Figure 7), no increase in background signal was observed.
Comparing with the results of the standard test, the PCB concentration level in the sample is roughly in the range of medium gramf (fg) to low gram (pg). The unlabeled PCBs were detected at concentrations of 0.2 and 1.0 pg/μL, and the internal standard concentration of all added 13C labels was 100 pg/μL. The selectivity of the TSQ Quantum XLS virtually eliminates background interference, resulting in lower method detection limits, reliable quantitative results, and accurate identification of compounds.
in conclusion
The Thermo Scientific TSQ Quantum XLS facilitates the screening and quantification of low-level PCBs in complex matrix samples and provides highly reliable results. This analytical method follows USEPA Method 1668A using isotope dilution quantification. The detection of complex matrix samples shows that the addition of 13C-labeled internal standard components enables highly reliable detection.
The corroboration method provides information on the chemical structure of the analyte. The unique hyperbolic quadrupole technology of the TSQ Quantum XLS provides unparalleled selectivity for the detection of low-level PCB samples in complex matrices including eggs, milk, cabbage and blood. When running the TSQ Quantum XLS in H-SRM mode, you can observe the typical distribution pattern of the PCB observed when using a high resolution mass spectrometer such as a sector magnetic mass spectrometer.
The MS/MS measurement method proposed by this method using two primary ions and detecting different SRM ion pairs is an effective solution for screening PCBs in various complex matrices. For food control, the GC-MS/MS with TSQ Quantum XLS exceeds at least four identification points of current EU directives, and the method described in this paper provides five identification points.
For third-party and government surveillance laboratories, the TSQ Quantum XLS also provides a high productivity solution for high sample throughput of complex matrix samples. Thanks to the easy sample preparation method, TSQ Quantum XLS provides unparalleled analytical performance for PCB trace analysis with additional economic advantages.
references
1. General information about PCBs, see
2. Fiedler, H., Polychlorinated Biphenyls (PCBs): Uses and Environmental Releases, UNEP Persistent Organic Pollutants.
3. Turner, WE; Welch, SM; et al., Instrumental approaches for improving the detection limit for selected PCDD congeners in samples from the general US population as background levels
Continue to decline, Proceedings of the Dioxin Conference, Oslo 2006.
4. Method 1668, Revision A: Chlorinated Biphenyl Congeners in Water, Soil, Sediment, and Tissue by HRGC/HRMS, United States Environmental Protection Agency, Office of Water, EPA No. EPA-821-R-00-002, December 1999
5. EU Commission Directive 96/23/EC concerning the performance of analytical methods and the interpretation of results, 12 August 2002, see http://eur-lex.europa.eu
Comment
The following abbreviations are used in this article:
MoCB = monochlorobiphenyl
DiCB = dichlorobiphenyl
TrCB = trichlorobiphenyl
TeCB = tetrachlorobiphenyl
PeCB = pentachlorobiphenyl
HxCB = hexachlorobiphenyl
HpCB = heptachlorobiphenyl
OcCB = octachlorobiphenyl
NoCB = nonachlorobiphenyl
DeCB = dodecylbiphenyl
The equivalent number is followed by "L" to indicate the labeled compound.
Table 4. TSQ Quantum XLS H-SRM Analysis Period

Table 5. Each SRM parameter for acquisition periods 1 through 6


Raw data was collected using a Thermo Scientific TSQ Quantum GC. The performance of the Thermo Scientific Quantum XLS typically meets or exceeds these results.
Rechargeable Hearing Aid
Rechargeable Hearing Aid
Shenzhen Sunshine Technology Co.,Ltd , https://www.shenzhenyatwin.com